Methodology
ResilienceArc provides a holistic assessment of companies’ exposure to, and management of, physical climate risk. ResilienceArc addresses a key gap in physical climate risk assessment by combining asset-level exposure data with corporate disclosures on adaptation actions.
While there is broad consensus that companies should identify and quantify exposure to physical climate hazards, there is limited guidance on how to assess whether those risks have been adequately mitigated. Two companies may face the same exposure, but the resulting risk can differ significantly depending on the adaptation measures they have implemented.
By linking exposure with evidence of resilience, ResilienceArc provides a more complete view of physical climate risk.
2.Overview of datasets and methodologies
ResilienceArc comprises two core components:
- Assessments of companies’ physical risk exposure and their significant hazards: ResilienceArc provides open data assessing corporate exposure to physical risk, provided by XDI. These physical risk assessments are powered by asset-based data and market-leading risk models. The models integrate the latest IPCC’s AR6 climate scenarios and include asset-level assessments of vulnerability to 11 hazards, up to the year 2100, under four separate RCP scenarios. Visualisations of these assessments include asset maps, which allow users to explore how and where physical risks are concentrated, alongside multiple scenario views showing how these risks evolve under different climate pathways.
Assessments of corporate risk assessment and management based on disclosure data: ResilienceArc uses LSE EarthCap’s Corporate Resilience Alignment Benchmark (C-RAB) methodology to evaluate how companies are assessing and managing those physical climate risks most material to their operations. The C-RAB methodology aligns with leading disclosure standards and regulatory regimes, including ISSB IFRS S1 and S2, TCFD, TNFD, ACT Adaptation, CDP Climate Change Questionnaire, and EU CSRD ESRS E1, among others.
Corporate assessments provided by LSE EarthCap are based on analysis of corporate disclosures using a state-of-the-art large language model (LLM) co-developed with the University of Zurich. Additional quantitative data on corporate spending on resilience-aligned activities is provided by Corporate Knights and derived from their Sustainable Economy Taxonomy dataset.
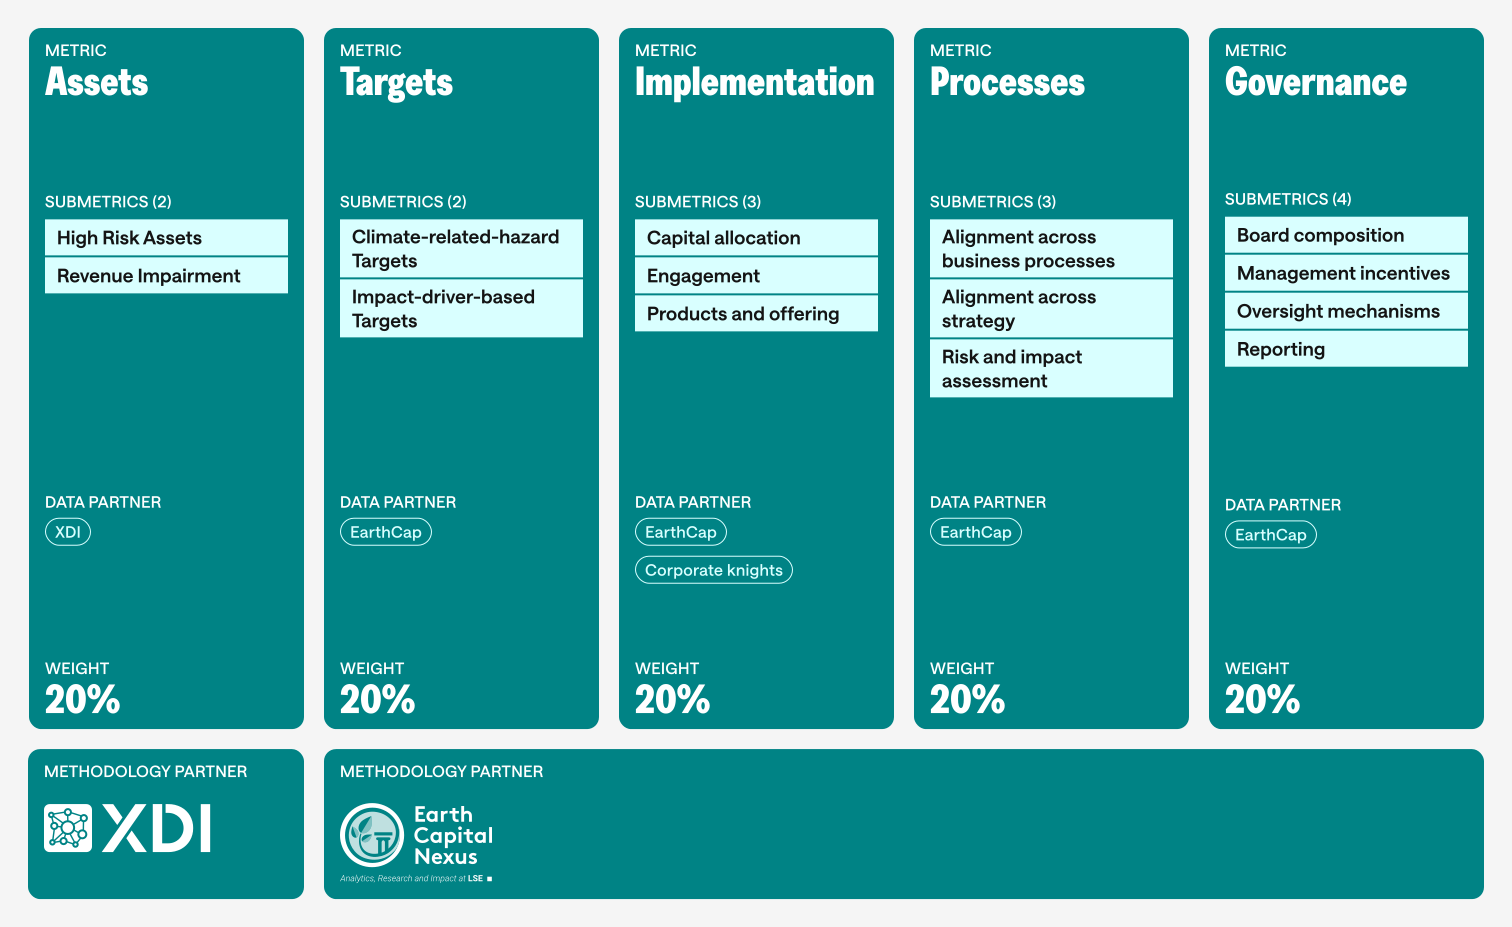
These assessments are integrated into an overarching framework organised across five core metrics: Assets, Processes, Implementation, Governance, and Targets. Over 200 indicators power a company’s score against each of these metrics. These metrics are explained in Section 2.2.
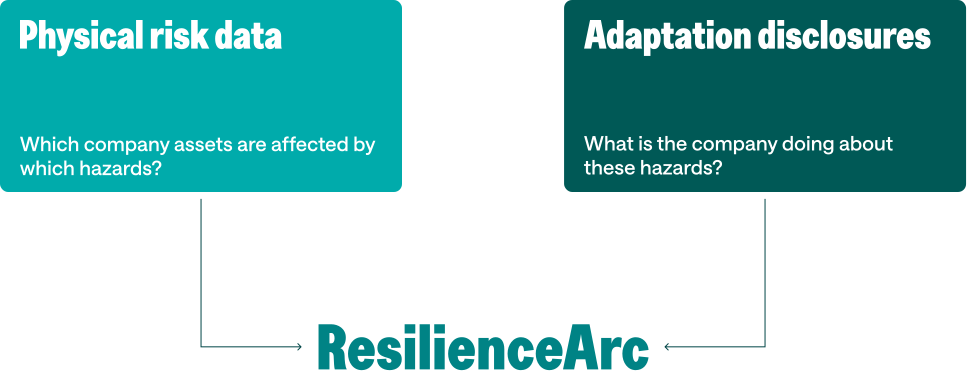

ResilienceArc also introduces two additional layers of analysis on top of assessments provided by XDI and LSE EarthCap:
- A ‘significant hazard’ threshold that establishes a relationship between the XDI and LSE EarthCap datasets (see Section 3.4.3 for more detail); and
- A set of science-aligned and peer benchmarks that enable a comparative analysis of the companies assessed (see Section 2.3 for more detail).
These layers are discussed in more depth in the following sections.
ResilienceArc has been designed to optimise interoperability as a core development principle (see Section 6.3). This reflects Arc’s mission to build a free and open public good infrastructure that benefits the broader climate transition ecosystem.
ResilienceArc is fully aligned with and based on the C-RAB framework for the metrics described in (Sections 2.2.2-2.2.5). In future, there is scope to amend the qualitative metrics and underlying indicators to accommodate methodological innovations, user requirements, and science-based pathways.
Similarly, the quantitative risk data incorporated under the Assets metric (Section 2.2.1) could, in theory, be provided by multiple data providers and organised according to an alternative or expanded set of indicators.

2.Metrics, sub-metrics, and weightings
ResilienceArc comprises five metrics and 14 sub-metrics. These are outlined below.
2.2.1 Assets
The Assets metric assesses a company’s exposure to physical climate risk. It comprises two underlying sub-metrics: (1) High Risk Assets; and (2) Revenue Impairment.
- High Risk Assets: This sub-metric assesses the ratio of a company’s assets that are designated as “high risk”. An asset’s risk level is determined by its “Maximum-To-Date Value-At-Risk (MVAR)” value. MVAR is a measure of an asset’s maximum potential damage caused by climate-related hazards in any previous year. Expressed as MVAR%, this value indicates the financial losses that a company stands to lose from that asset owing to damage from climate-related hazards. Any asset with an MVAR greater than 1% is designated as high-risk. A more detailed description of the underlying methodology is available in Section 3.
- Revenue Impairment: This sub-metric estimates broader business impacts of a climate-related hazard by aggregating both direct and indirect operational disruptions. This estimate is expressed as % annual revenue impairment and is calculated for each country a company operates in, as well as at a worldwide level. In each case, the assets contained in the chosen geographical area are aggregated together. It is comprised of four underlying indicators:
- Direct Productivity Loss: Productivity loss owing to an asset’s outage or downtime.
- First Mile Indicator: Productivity loss associated with disruption to surrounding critical infrastructure.
- Regional Economic Indicator: Productivity loss associated with regional economic disruption.
- Supply Chain Proxy: Productivity loss associated with supply chain disruption.
Weighting: A company’s overall Assets score is equivalent to the lowest score across these two sub-metrics, i.e. if a company scores less favourably on Revenue Impairment than it does on High Risk Assets, 100% of the score weighting will be attributed to Revenue Impairment, and 0% to High Risk Assets. The Assets metric accounts for 20% of a company’s overall score in ResilienceArc.
2.2.2 Processes
The Processes metric aligns with LSE EarthCap’s C-RAB methodology and comprises three underlying sub-metrics: (1) Alignment across business processes; (2) Alignment across strategy; and (3) Risk and impact assessment.
- Alignment across business processes: This sub-metric assesses the degree to which a company demonstrates alignment in its processes with regard to environmental risk and impact assessment, people-related risk and impact assessment, and to mainstream adaptation and resilience, and the principle of “Do No Significant Harm” (DNSH).
- Alignment across strategy: This sub-metric assesses the extent to which a company integrates adaptation and resilience, and the principle of DNSH into its business strategy.
- Risk and impact assessment: This sub-metric assesses the scope of a company’s financial materiality risk and opportunity assessment, risk assessment, impact assessment, and scenario analysis.
Weighting: A company’s score against “Alignment across business processes” accounts for 40% of its Processes score; “Alignment across strategy” accounts for 20%; and “Risk and impact assessment” accounts for 40%. The Processes metric accounts for 20% of a company’s overall score in ResilienceArc.
2.2.3 Implementation
The Implementation metric aligns with LSE EarthCap’s C-RAB methodology and comprises three underlying sub-metrics: (1) Capital allocation; (2) Engagement; and (3) Products and offering.
- Capital allocation: This sub-metric assesses both whether a company has a fully costed adaptation plan, and the share of capital invested by a company in nature-based or adaptation solutions. Data for this sub-metric is provided by Corporate Knights.
- Engagement: This sub-metric assesses a company’s engagement with value chain partners and with government on physical risks and adaptation.
- Products and offering: This sub-metric assesses both the share of a company’s revenue derived from activities that build resilience, and whether a company is involved in ethically or environmentally questionable industries and/or practices that do significant harm to society and/or nature.
Weighting: A company’s score against “Capital allocation” accounts for 22% of its Implementation score. Its score against “Engagement” accounts for 52%, and against “Products and offering” for 26%. The Implementation metric accounts for 20% of a company’s overall score in ResilienceArc.
2.2.4 Governance
The Governance metric aligns with LSE EarthCap’s C-RAB methodology and comprises four underlying sub-metrics: (1) Board composition; (2) Management incentives; (3) Oversight mechanisms; and (4) Reporting.
- Board composition: This sub-metric assesses the extent of board-level expertise in adaptation and resilience.
- Management incentives: This sub-metric assesses the degree of alignment of management incentives with adaptation and resilience metrics.
- Oversight mechanisms: This sub-metric assesses the level of oversight and responsibility for climate- and nature-related risk and adaptation within a company.
- Reporting: This sub-metric assesses a company’s policies relating to climate- and nature-related issue audits and whistleblowing.
Weighting: A company’s score against “Board composition” accounts for 14% of its Governance score; “Management incentives” accounts for 17%; “Oversight mechanisms” for 55%; and “Reporting” for 14%. The Governance metric accounts for 20% of a company’s overall score in ResilienceArc.
2.2.5 Targets
The Targets metric aligns with LSE EarthCap’s C-RAB methodology and comprises two underlying sub-metrics: (1) Climate-related-hazard targets; and (2) Impact-driver-based targets.
- Climate-related-hazard targets: This sub-metric assesses whether a company has set time-bound and specific targets to address its significant climate-related hazards.
- Impact-driver-based targets: This sub-metric assesses whether a company has set time-bound and specific targets to address significant direct drivers of environmental harm (defined at industry level).
A company is assessed on climate-related-hazard targets only in relation to those hazards with the largest financial impact for a given company. This is defined as hazards that lead to direct productivity loss for at least 5% of the days in the year or drive at least 0.5% MVAR on a high or medium risk asset. Further explanation of how this threshold is set and calculated is included in Section 3.4.3.
A company is assessed on impact-driver-based targets for direct impact drivers considered material or relevant for a company. Sector-specific direct impact drivers are derived from ENCORE materiality assessments, as described in LSE EarthCap’s C-RAB methodology.
Weighting: Weightings within the Targets metric are dynamically adjusted between the “Climate-related-hazard targets” and “Impact-driver-based targets” sub-metrics based on each company’s total number of significant hazards and direct impact drivers. The final sub-metric weighting is the total ratio of significant hazards to direct impact drivers. For example, if a company has six significant hazards and four direct impact drivers, the weighting of the “Climate-related-hazard targets” sub-metric will be 60%, and the weighting of the “Impact-driver-based targets” will be 40%. The Targets metric accounts for 20% of a company’s overall score in ResilienceArc.
2.Benchmarks
“Resilience-aligned” refers to a company that has incorporated available best practices—through its activities, planning processes and governance structures—to enable society to become more resilient to the impacts of climate change.
Within ResilienceArc’s metrics and sub-metrics, companies achieving a score of 1 or above are classed as resilience-aligned. Sector-level comparisons highlight what “good” looks like for corporate resilience, helping identify leaders and laggards across industries. Companies can be benchmarked against a peer-reviewed standard for resilience alignment, or against sector or peer leaders.
ResilienceArc combines varied, complex, and interdisciplinary data into one consolidated view. Comparison of each relevant datapoint against a normalised threshold (or benchmark) enables this consolidation. In practice, this means that each piece of data within a company’s resilience profile, whether asset- or disclosure-based, is benchmarked against a science-aligned or expert-reviewed threshold representing alignment with best practice resilience and adaptation at a granular level.
Benchmarking within the Assets metric was determined by XDI at the sub-metric level and is described in Section 3.4. Benchmarking for the Implementation, Processes, Governance, and Targets metrics is defined by the C-RAB framework and is defined at individual, granular leaf node indicators sitting below each sub-metric. Each leaf-node indicator is assessed against a best practice benchmark for resilience alignment.
| Metric | Sub-metric | Leaf node indicator | Resilience-aligned benchmark of leaf node |
|---|---|---|---|
| Governance | Management incentives | Who is entitled to performance incentives that refer to adaptation and resilience metrics (including risk, water, pollution or land use)? | Highest level of accountability or decision-making within the organisation, with responsibility for overall organisational or corporate strategic direction (e.g. board, CEO). |
| What is the type of adaptation and resilience-related performance incentive? | The company has introduced adaptation metrics (key performance indicators (KPIs)), including metrics related to risk, water, pollution or land use, within its long-term incentive plan (likely to include equity in the company). | ||
| Targets | Climate-related hazard targets | Has a target for the company’s Extreme Heat-related risk been set (if Extreme Heat is significant based on asset level assessment)? | Yes – target set |
| Target time‑bound? | Yes- target is time-bound | ||
| Does the target provide hazard severity? | Yes – target provides hazard severity | ||
| Does the target provide geography covered? | Yes – target provides geography covered | ||
| Does the target provide proportion of assets covered? | Yes – target provides proportion of assets covered |