Methodology
XDI analysis powers the “Assets” metric of ResilienceArc. This analysis comprises the following components:
- company asset discovery and mapping;
- asset-level physical climate risk analysis;
- indirect and dependency risk indicator computations;
- adaptation analysis; and
- resilience performance definitions and indicators.
Together, these components support a broader understanding of corporate climate resilience by connecting quantified physical climate risk with resilience and adaptation commitments assessed and codified according to LSE EarthCap’s C-RAB framework (see Section 4).
3.Asset discovery and mapping
A key challenge in assessing corporate physical climate risk is that detailed asset data is often unavailable, incomplete, or difficult to obtain at scale, particularly when analysing public companies, subsidiaries, counterparties, or large portfolios. To address this challenge, ResilienceArc uses XDI’s Multiple Company Intelligence capability to identify, organise, and analyse the physical footprint of companies included within the platform.
Multiple Company Intelligence is a suite of XDI processes, analytical methodologies, and datasets designed to calculate quantitative physical climate risk metrics for individual companies and portfolios of companies. The product enables users to assess and compare climate-related physical risks across a company’s portfolios of owned and leased assets by estimating potential financial losses at multiple levels of interrogation. Analysis can be performed using known asset locations, or—where asset-level information is unavailable—XDI can surface owned and leased asset locations from publicly available data, third-party sources, and proprietary asset databases.
Multiple Company Intelligence produces climate risk metrics at both the asset level and the company level. Asset-level metrics are calculated by hazard and aggregated to provide portfolio-wide loss estimates. Company-level metrics are reported by hazard, by country, and at a global level, enabling consistent comparison and analysis across geographies and portfolios.
The sections below provide more information about the methodologies XDI uses to perform this analysis.
3.XDI’s approach to measuring risk
To calculate risk, XDI has developed a bottom-up engineering approach, XDI Structural Analysis. XDI Structural Analysis uses an engineering model that calculates risk to individual assets by running analyses on representative archetypes comprised of the physical elements that make up each asset and the dependencies between them—an approach that is unique to XDI.
Structural Analysis combines archetype and asset-specific information, hazard projections, and spatial context data from the asset's location to calculate direct risk as damage and failure probabilities and financial consequences for each element within the asset. This is then aggregated to the asset level to determine overall hazard impacts.
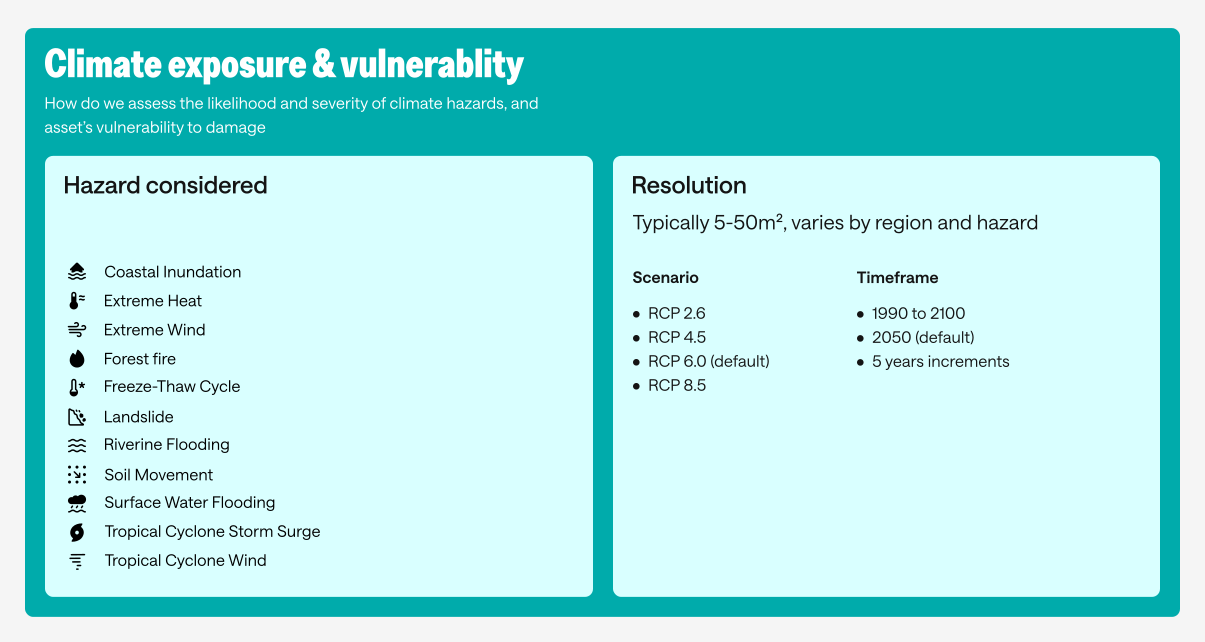
Rather than assessing climate hazards alone, XDI’s Structural Analysis evaluates how climate hazards interact with the physical characteristics of assets to determine resulting damage and disruption outcomes. Instead of using generalised vulnerability functions, this is done by building a digital twin of assets, placing them in location, and then testing them against extreme weather and climate hazards specific to that location, and under different scenarios and time steps.
This process combines:
- engineering representations of assets;
- climate hazard projections;
- asset-specific information; and
- spatial and contextual information relating to asset location.
An introduction to XDI’s Structural Analysis approach, and additional documentation relating to XDI’s methodologies, can be accessed via LearnXDI.
3.Understanding the nature of risk
XDI’s Structural Analysis methodology produces a number of metrics to quantify physical climate risk and resilience.
These metrics can be grouped into two dimensions:
- whether climate impacts result in physical damage or operational disruption; and
- whether impacts arise directly to the asset or indirectly through dependencies beyond the asset.
Physical climate impacts do not always result in the same outcomes. Damage metrics quantify physical impacts to assets resulting from climate hazards that damage elements of an asset. Disruption metrics quantify operational impacts, including periods where assets remain intact but experience reduced performance or periods of unavailability. Both damage and disruption outcomes contribute to understanding physical climate resilience and its financial consequences.
Direct physical climate risk refers to impacts arising directly to physical assets due to climate hazards, including damage, failure, and operational disruption. Indirect physical climate risk refers to impacts that arise through dependencies beyond the asset itself. These may include disruptions that affect operations and business performance to surrounding infrastructure, regional economic systems, and trade-based supply chains. Together, direct and indirect analysis provide a broad understanding of how climate hazards may translate into physical and operational outcomes across companies and their asset systems.
These two dimensions are captured in the two sub-metrics underlying a company’s Assets score in ResilienceArc, as outlined in Table 2 here:
| Risk dimension | Risk metric | Associated ResilienceArc sub-metric |
|---|---|---|
| Direct risk metrics | Maximum-To-Date Value-At-Risk (MVAR) | High Risk Assets |
| Direct Productivity Loss (PL) | Revenue Impairment | |
| Indirect risk metrics | First Mile Indicator (FMI) | |
| Regional Economic Indicator (REI) | ||
| Supply Chain Proxy (SCP) |
The sections below provide further detail on the component metrics across these two dimensions.
3.3.1 Direct risk metrics
Direct risk metrics assess an asset’s vulnerability to damage and disruption from physical climate risks.
Maximum-To-Date Value-At-Risk (MVAR)
MVAR is an asset's overall maximum-to-date value-at-risk. It is a measure of an asset's maximum potential damage caused by climate-related hazards in any previous year. The maximum-to-date adjustment ensures that no year has a lower risk than the previous year. This adjustment is a cumulative maximum across time. MVAR is based on the relative risk contribution of the structural elements that make up the asset in XDI’s structural model.
MVAR can be expressed as a decimal fraction (MVAR) or percentage (MVAR%).
Direct Productivity Loss (PL)
Productivity Loss (PL) considers the effects of different types of disruption, including periods of closure associated with different hazard events. Productivity Loss is calculated using Failure Probability (FP). Failure Probability (FP) is the annual probability of a climate hazard causing the asset to stop working with or without damage in any previous year. Failure Probability is dependent on the vulnerability of an archetype’s elements to a particular hazard. An element can fail without being damaged; a failed element may also cause other dependent elements to fail.
A maximum-to-date adjustment ensures that no year has a lower risk than the previous year. This adjustment is a cumulative maximum across time. Failure Probability is then combined with expected downtime assumptions specific to each hazard.
Total Productivity Loss is aggregated by summing hazard-level PL values across hazards in the analysis. Productivity Loss is expressed as a proportion of the expected days of asset unavailability in a year.
3.3.2 Indirect risk metrics
Indirect risk metrics assess disruption pathways beyond the asset itself.
First Mile Indicator (FMI)
The First Mile Indicator (FMI) gives a score for the vulnerability of the area immediately surrounding a company’s assets. In some instances, an asset may not be particularly at risk from climate hazards, but nearby local infrastructure such as power stations, substations, and supply roads upon which the asset operation relies may be at risk.
Regional Economic Indicator (REI)
The Regional Economic Indicator (REI) extends analysis beyond the immediate locality of the asset to consider broader regional disruption that may influence suppliers, buyers, workers—and therefore productivity. The area of aggregation can vary, but in this analysis, it is aggregated to the first sub-national administrative jurisdiction for most countries. This is considered the “regional economy” within which the company operates via these assets.
REI provides a metric for the vulnerability of the region where the company’s asset is located. Assets are assigned the risk from the area in which they sit.
Supply Chain Proxy (SCP)
Supply Chain Proxy (SCP) assesses potential supply chain impairment based on the national and international sectors upon which company assets are likely dependent. The methodology applies sector-based dependencies using domestic and international trade data to provide a proxy measure of climate-related supply chain disruption, including the extent to which a company may be able to adapt by switching suppliers.
SCP is designed to contextualise asset-level analysis within wider domestic and international economic systems.
3.Physical risk metrics in ResilienceArc
ResilienceArc builds on existing XDI physical climate risk metrics to introduce indicators designed to support interpretation of company resilience. These indicators aggregate existing XDI outputs to provide a company-level view of resilience.
Within ResilienceArc, XDI has established two resilience indicators: (1) Asset System Resilience (expressed in ResilienceArc as the “High Risk Assets” sub-metric); and (2) Revenue Impairment resilience interpretation (expressed in ResilienceArc as the “Revenue Impairment” sub-metric).
3.4.1 High Risk Assets
The “High Risk Assets” sub-metric in ResilienceArc uses XDI’s Asset System Resilience indicator. This interprets the distribution of company assets across XDI’s three risk bands. These risk bands provide a simplified view of damage outcomes, based on MVAR%, and are derived from US Federal Emergency Management Authority (FEMA) categorisations for insurability. They are as follows:
- High Risk Assets (HRA): assets with MVAR ≥ 1%;
- Moderate Risk Assets (MRA): assets with MVAR between 0.2% and 1%; and
- Low Risk Assets (LRA): assets with MVAR < 0.2%.
Within ResilienceArc, the proportion of High Risk Assets is used as an indicator of company-level asset resilience. The proportion is then classified as:
- High Portfolio Resilience: companies with 0% High Risk Assets;
- Average Resilience: companies with 5% High Risk Assets; and
- Low Resilience: companies with values above 5% High Risk Assets.
3.4.2 Revenue Impairment
Physical climate impacts may affect business performance through multiple disruption pathways. For the analysis it provides to ResilienceArc, XDI combines direct and indirect disruption to estimate broader operational impacts, referred to as ‘Revenue Impairment.’
Revenue Impairment is an existing XDI metric that estimates broader business impacts by aggregating direct and indirect operational disruption. Results are delivered as a single metric.
Within ResilienceArc, Revenue Impairment is additionally used as an indicator of operational resilience. Defining these thresholds is an area of continued development, but initial thresholds as they appear in ResilienceArc today are as follows:
- Resilient: <0.5% annual revenue impairment, equivalent to 1-in-500-year event.
- Moderate: 0.5–0.75%, equivalent to 1-in-500-year to 1-in-200-year event. This implies a risk level that is material but manageable.
- Elevated resilience concern / High revenue impairment risk: ≥0.75%. For a typical company with corporate profit of 10%, this is equivalent to a 10% loss of profits.
These thresholds draw on concepts from insurability and financial resilience and are intended to support interpretation of resilience outcomes rather than define financial loss.
The Revenue Impairment calculation aggregates four metrics of productivity loss:
- Productivity Loss (PL): Direct productivity loss associated with asset availability
- First Mile Indicator (PL_FMI): Productivity loss associated with critical infrastructure disruption
- Regional Economic Indicator (PL_REI): Productivity loss associated with regional economic disruption
- Supply Chain Proxy (PL_SCP): Productivity loss associated with supply chain disruption
Revenue Impairment is not, however, a simple sum of these components. Rather:
- It is linearly related to direct productivity loss.
- It varies according to approximately the cube of FMI due to the multiple channels of failure from each critical infrastructure supply.
- It varies according to approximately the cube of REI due to the impact on upstream suppliers, downstream buyers and direct staff.
As additional independent disruption pathways are introduced, total disruption increases non-linearly. For lower levels of disruption, combined losses approximate the sum of individual impacts. At higher levels, saturation effects occur as total disruption approaches practical limits. To reduce double counting, each of the four components is designed to represent a distinct disruption mechanism. The framework assumes independence between disruption pathways. In practice, correlations may exist between mechanisms and are recognised as an area for future refinement.
3.4.3 Defining "significant" hazards
ResilienceArc extends physical climate risk analysis by considering whether publicly disclosed adaptation actions appear relevant to the physical climate risks identified across a company’s assets and operations. This assessment is intended to move beyond measuring risk alone by exploring whether evidence exists that a company is identifying, prioritising and responding to its most material climate risks. The approach combines XDI’s physical climate risk analysis with LSE EarthCap’s assessment of publicly disclosed resilience and adaptation information.
The objective of this approach is not to assess whether adaptation commitments exist in isolation, but whether disclosed actions appear aligned to the hazards and asset systems that materially contribute to future damage and disruption outcomes.
The assessment currently follows five steps:
- Identify significant risk exposures (XDI): Assets with significant projected damage or operational disruption are identified using XDI physical climate metrics.
- Identify significant hazard drivers (XDI): For each asset portfolio, the hazards contributing significantly to projected damage (MVAR) and operational disruption (PL) are identified. Hazards with a smaller contribution are excluded.
- Assess adaptation relevance (LSE EarthCap): Company disclosures are analysed to identify evidence of adaptation actions, resilience planning, risk mitigation measures and forward-looking commitments relevant to the identified hazards.
- Capture implementation characteristics (LSE EarthCap): Where adaptation activity is identified, additional information is captured where available, including:
- assets or portfolios covered;
- implementation timeframe;
- intended outcomes or performance assumptions; and
- treatment of indirect and dependency risks.
